News & Publications


article thumbnail

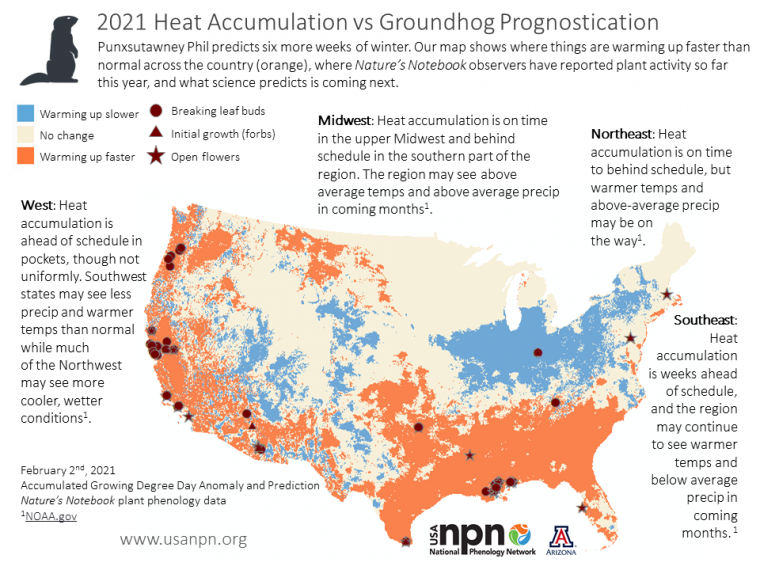
2020 Heat Accumulation vs Rodent Prognostication

Sun, Feb 02, 2020

Punxsutawney Phil predicted an early spring this year! Our maps of heat accumulation provide a more scientific look at how much heat has accumulated so far this year, and what's next. Heat accumulation is ahead of schedule in the Southeast, Northeast, and parts of the West, and more typical in Midwest states.

article thumbnail

Where there are flowers, there could be fire

Wed, Jan 29, 2020

Flowering in chamise, a widely distributed plant in fire-prone chapparal California, is a good indicator of fire risk. Data contributed to Nature’s Notebook helped researchers identify that a critical live fuel moisture threshold is crossed after the plant has flowered but before fruits have developed. Accordingly, managers can readily and inexpensively assess live fuel moisture status in these areas simply by looking at chamise flower and fruit status. This study shows the potential for phenology information from programs like Nature’s Notebook to inform critical management decisions.


article thumbnail

Urbanization advances phenology in cold regions but not warm ones

Mon, Nov 25, 2019

Authors of a new study using Nature's Notebook data found that in cold regions, urbanization leads to earlier leaf-out and flowering in plants. However, in warmer temperate and sub-tropical regions, urbanization delays leafing and flowering. The authors speculate several reasons for this difference, including a lack of winter chilling that some plants require, heat stress, or a greater influence of other aspects of urbanization besides heat. Phenology can serve as the “canary in the coal mine” for climate change impacts on our environment, so keep those Nature’s Notebook observations coming!


article thumbnail

2.5 million NEON records added to National Phenology Database

Thu, Nov 14, 2019

The National Ecological Observatory Network (NEON) uses USA-NPN observational protocols to track plant phenology. In October of 2019, we ingested over 2.5 million phenology data records collected on more than 5,000 individual plants observed at 78 NEON sites collected between 2013-2019 into the USA-NPN's National Phenology Database. These data are reflected in the map of observation records below and are available for visualization and download.


article thumbnail

First ever Local Phenology Leader Clinic and Rally, Oct 2019

Sat, Oct 05, 2019

On October 4-5, 2019, the USA-NPN's National Coordinating Office (NCO) hosted the first Clinic designed specifically for Local Phenology Leaders (LPLs) working on long-term Local Phenology Programs (LPP) using Nature's Notebook. The Clinic was inspired by the gathering for the 10-year anniversary of the USA-NPN in October 2018, where many Leaders said they would welcome the opportunity to get together again in person and share id


article thumbnail

Citizen science programs help urban growers manage insects

Wed, Sep 25, 2019

Urban growers need information about how best to manage pests, for example, knowing when to apply a pesticide to have the least likelihood of impacting a beneficial pollinator. Data resulting from citizen science programs like Nature’s Notebook, iNaturalist, and eButterfly can support urban growers’ efforts to increase the presence of pollinators and other beneficial insects and decrease insect pests. Growers can use these platforms to support insect identification, store their data in a standardized format, compare their data to those from other farms, and predict when pests will be most vulnerable to treatment.


article thumbnail

The early fish misses the phytoplankton

Wed, Jul 24, 2019

The timing of phytoplankton blooms is critical to the survival of fish including haddock, herring, and salmon. The authors looked at the impact of a high-emissions climate warming scenario on two groups of fishes that live in the surface layer of the ocean and spawn in springtime. Fish species that rely on geographic features such as rivers are predicted to change their spawning timing twice as fast as phytoplankton bloom timing, resulting in spawning occurring earlier than phytoplankton bloom across 86% of the area studied. Mismatches in this ecosystem could cause population declines with cascading effects on global carbon cycles.